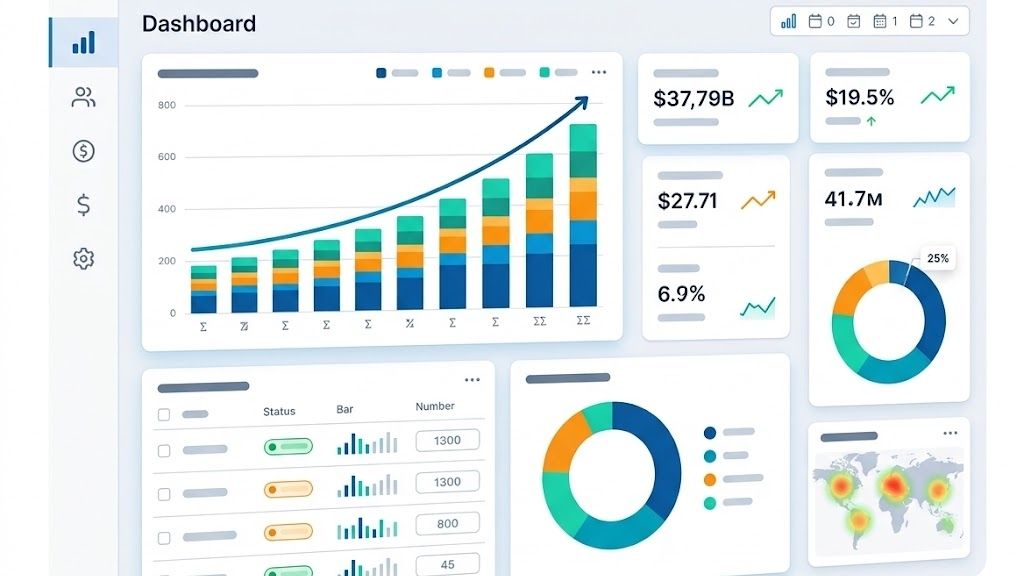
A funder’s Monday meeting lives or dies by its dashboards, and too many shops run it on numbers someone assembled the night before. The direct answer: funders need dashboards in four families, pipeline and conversion, funded deal reporting, portfolio performance metrics, and team and partner productivity, all rendered live from the deal ledger inside the platform. An MCA CRM that serves those four views replaces the spreadsheet night with a screen that is already correct when the meeting starts.
The principle underneath everything is simple: a report should be a view of data the system already holds, not a separate job. When remittances post to the ledger, collection rates update themselves; when a deal funds, volume and mix update themselves. This guide walks through each dashboard family, the specific metrics worth watching, and how to roll the stack out so the numbers drive decisions instead of decorating them.
The short answer is four families that together answer every question leadership asks. In practice that means:
• Pipeline and conversion: how deals flow and where they stall
• Funded deal reporting: what got funded, on what terms, from what sources
• Portfolio performance metrics: how the funded book is behaving right now
• Collections and renewals: delinquency, recovery, and reflow health
• Team and partner productivity: who is producing, inside and outside the shop
Notice the sequence, because it mirrors the money. First the deal is sold, then it is funded, then it collects, then it renews, and someone is accountable at each step. A dashboard family exists for each, and a gap in any one of them is a blind spot in the business.
The pipeline view answers the first question a funder has: what is coming, and where does it break? A funnel widget should show the counts moving from inquiry to contacted to qualified to submitted to offer to funded, with conversion between each pair of stages. Pull-through, the submission-to-funding rate, is the single most quoted number in the funnel, and the stage-by-stage view shows which transition actually needs attention.
Speed belongs on the same screen. Time to first touch, contact rate on fresh inquiries, and days from submission to decision measure whether the operation competes on pace, which in this industry is most of the game. Stage aging adds the stall detector: deals sitting in Documents or Underwriting past a threshold surface on the exceptions list before they quietly die.
Source attribution closes the loop. The funnel should slice by lead source, campaign, and ISO partner, because a pipeline that converts well from referrals and poorly from a paid source is a budget decision waiting to be made. Attribution only works when it is captured at inquiry, which is the pipeline dashboard’s quiet dependency on upstream discipline.
Funded deal reporting is the scoreboard of what the shop actually did. At minimum it shows count and dollar volume for the period, average advance size, average factor rate, product mix, industry mix, and geography. Trend lines against prior periods turn the scoreboard into a trajectory, and the mix views show whether concentration is building anywhere it should not.
| Metric | Definition | Why It Matters |
|---|---|---|
| Funded volume | Dollars advanced in the period | The headline growth number |
| Funded count and average size | Volume split into deals | Shows whether growth is broad or lumpy |
| Average factor rate | Pricing across the book | Margin pressure or quality signal |
| Pull-through rate | Submissions that funded | Sales and underwriting efficiency |
| Renewal share | Volume from existing merchants | Health of the compounding engine |
| Cost per funded deal | Spend divided by funded count | Marketing and partner efficiency |
Cohort views are where funded deal reporting gets honest. Tracking each funding period as a vintage reveals whether deal quality is improving or sliding in ways the aggregate average conceals, because a book with a strong overall collection rate can still hide a soft recent cohort. Vintage analysis is the difference between reporting history and predicting it.
Portfolio performance metrics are where dashboards earn their keep, because they describe money already deployed. A purpose-built MCA CRM computes these live from the remittance ledger: total outstanding balances, the total remaining to be collected across the book, collection rate against expected remittances, and the projected payback dates for every active deal. When the ledger updates daily, these numbers update with it, with no analyst in the loop.
The risk metrics live beside the health metrics. Delinquency aging by bucket, NSF and return rate trends, default rate as a share of funded capital, and recovery ratios tell the funder how the downside is behaving. A collection rate that looks strong overall can mask deterioration in newer vintages, which is exactly the pattern the aging and cohort views exist to expose.
The collections dashboard extends aging into workload and outcomes. It should show the active delinquency queues, daily and weekly collections against scheduled, collector productivity in contacts and right-party connects, and promise-to-pay kept rates. Recovery ratio by aging bucket answers the question that justifies the whole function: how much comes back, from how deep in delinquency.
Renewals drive the economics of the industry, and the dashboard should prove it. The renewal pipeline view lists merchants approaching eligibility with their remaining balances and projected reflow value, while renewal rate, time from eligibility to funded renewal, and revenue per merchant measure how well the shop harvests what it plants. Stacking and position indicators on the same view show when the next conversation is with a competitor’s merchant.
The people views turn reporting into management. Rep leaderboards should track dials, contacts, submissions, and funded volume, ideally side by side with pipeline hygiene, so production is visible without encouraging stale-stage gaming. Underwriting throughput, decision times, and exception rates give the credit team the same treatment.
Partners deserve their own scoreboard. ISO submission volume, approval rates, funded volume, commission payouts, and renewal contribution identify which relationships actually produce, and syndicator position balances plus participation performance keep investor reporting honest. The same views that rank partners also protect commissions from being computed by hand.
| Dashboard | The Question It Answers | Typical Widgets |
|---|---|---|
| Pipeline funnel | Where do deals stall? | Stage counts, conversion, stage aging |
| Funded deals | What did we fund, on what terms? | Volume, mix, factor rates, cohorts |
| Portfolio health | How is the book performing? | Balances, collection rate, defaults |
| Collections aging | What is late, and what returns? | Buckets, recovery ratio, productivity |
| Renewal forecast | What reflows next? | Eligibility list, renewal rate, value |
| Partner performance | Who produces? | Submissions, approvals, commissions |
One ledger should feed every view. Dashboards that draw from the deal record and the remittance ledger cannot disagree with each other, while dashboards assembled from exports always eventually will. Every chart should drill down to the deals behind it, because a number you cannot click into is a number you cannot verify or act on.
Role-fit matters as much as content. A rep needs a personal pipeline and task view, a manager needs team funnel and hygiene, and a principal needs portfolio, funding, and partner views, with access permissions matching each. Cadence separates daily operating views from weekly management reviews and periodic cohort deep dives, so no single dashboard carries a burden it cannot support.
Start with questions, not charts. Write down the ten decisions leadership makes repeatedly, pick the metric that informs each, and configure those first; a dashboard built the other way accumulates widgets nobody reads. Backfilling historical deals makes trend lines meaningful on day one instead of misleading for a quarter.
If designing the set sounds like a project you would rather hand off, Contact us and we will build the dashboard stack around your shop’s actual decisions, from funnel to portfolio to partner views. The goal is a Monday meeting that starts with numbers instead of ending with them.
Platforms such as ConvergeHub render live dashboards directly from the deal records, documents, and remittance data the platform already holds, so pipeline, funding, portfolio, and partner views stay in agreement by construction. Reporting stops being a chore and becomes the interface to the business.
Four families cover it: pipeline and conversion, funded deal reporting, portfolio performance, and team and partner productivity. Each answers a different question leadership asks weekly, and together they trace a deal from inquiry through funding, collection, and renewal. Anything beyond those families is nice until it becomes noise.
They measure money already deployed: outstanding balances, remaining to be collected, collection rate against expected remittances, delinquency aging, default rate, and recovery ratios. Cohort views track each funding period as a vintage to reveal quality trends. Live numbers come from the remittance ledger, not a report someone builds.
Renewal rate over time, time from eligibility to funded reflow, renewal share of funded volume, and revenue per merchant form the core set. The renewal pipeline view adds the forward look: eligible and soon-eligible merchants with projected reflow value. Renewals drive industry economics, so this view earns its screen space.
Yes, and access controls should enforce it. Reps work personal pipelines and tasks, managers see team funnels and hygiene, and principals see portfolio, funding, and partner views. Same ledger, different lenses, prevents both overload and exposure of sensitive data. One size fits nobody.
Yes. Pipeline, funding, portfolio, and partner reporting draw live from the platform’s deal and remittance data, with views configurable to the shop’s roles. The numbers agree with the ledger because they come from it.
An MCA CRM should give funders dashboards in four families, pipeline and conversion, funded deal reporting, portfolio performance metrics, and productivity views, all rendered live from the deal ledger with drill-down to the deals themselves. The collection rate that updates itself, the renewal pipeline that forecasts itself, and the partner scoreboard that ranks itself are what separate a reporting capability from a reporting chore. Build the views around the decisions you actually make, and the dashboards become the meeting.
To see that stack configured for your book, schedule an appointment with ConvergeHub. We will map your decision points, build the funnel through portfolio views, and backfill the history so the trends mean something from day one. The data already exists in your deals; it is time it started talking back.